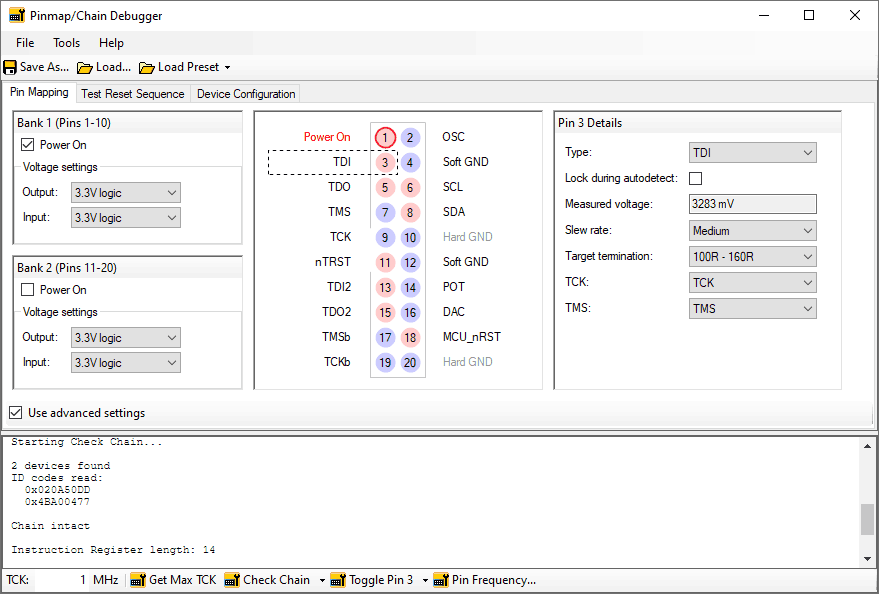
The JTAG Chain Debugger, installed with all XJTAG products, is a powerful tool designed to help you troubleshoot problems with your JTAG chain. You can tell the Chain Debugger to automatically try and identify the location of faults by exercising the devices in a JTAG chain. If further investigation is necessary you can use a range of built-in functions to help you track down the source of the problem. From debugging the JTAG chain on early prototype boards to resolving production line issues the tool can be used by engineers at all stages of the product life-cycle.
As well as debugging broken JTAG chains, the tool will also allow engineers to validate they have the correct BSDL files for all devices in the JTAG chain by matching not only the IDCODE but also the length of the boundary scan register in the device. Once the JTAG chain is working, the other products in the XJTAG system provide rapid means of testing the rest of the board.
Key Benefits
- Easy to setup complex multi port chains
- Quickly indentify location of faults in JTAG chains
- Simple tools to investigate faulty JTAG chains
Features
- Displays current state of JTAG pins
- Enables voltage and frequency of pins to be measured
- Quickly move the JTAG signals around on the connector
- Check IDCodes and boundary scan chain
- Checks maximum chain operation frequency
For support, or for a quote on any part of the XJTAG system, please contact us.


