Featured Capabilities
Waveform Viewer
Introduction
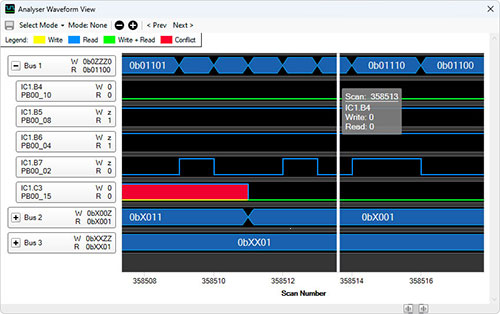
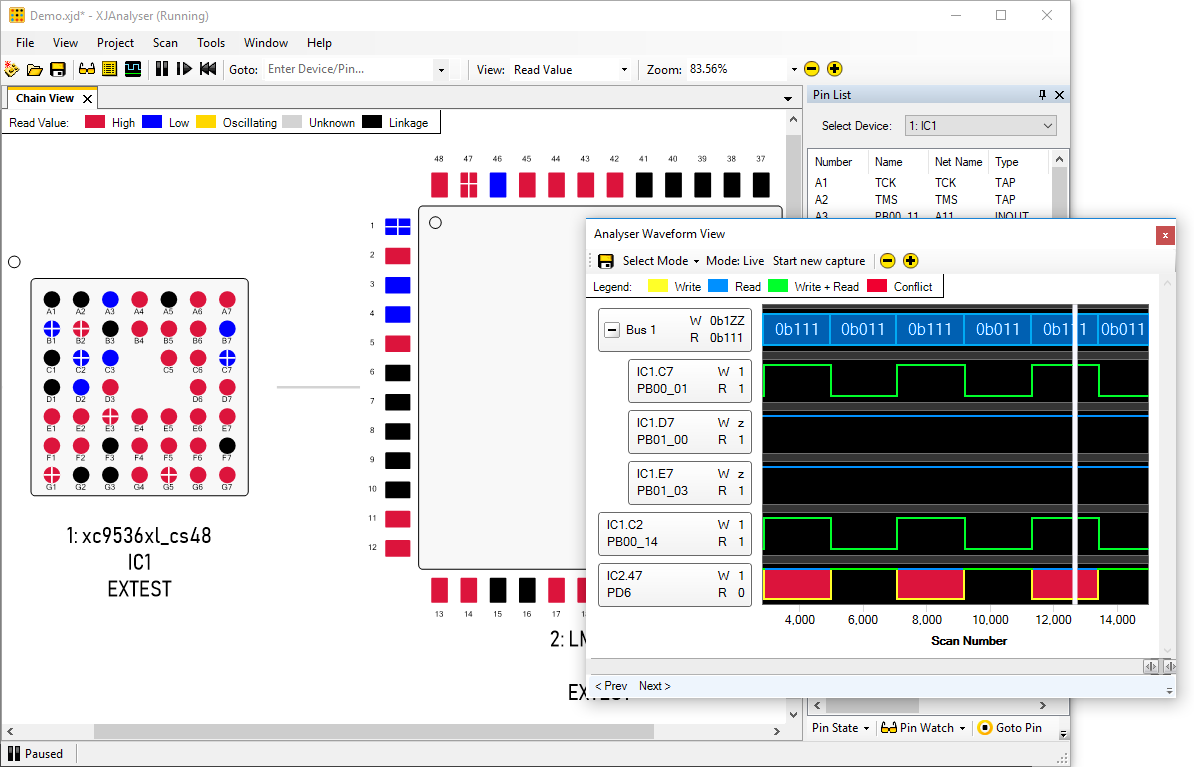
The Waveform Viewer offers a unique insight into your system. By displaying data in the form of digital waveforms, it represents a live and correlated view of JTAG chain data.
While Boundary Scan can’t claim to capture the point at which signals transition in real-time, Waveform Viewer provides a logic analyser-type view of your system’s digital activity, as it is captured by the Scan Chain. This brings several new and valuable capabilities to the debug and fault diagnostic process.
The Waveform Viewer is a standard feature in XJAnalyser and it is included as part of XJInvestigator and XJDeveloper.
Key Benefits
- Visualise digital data graphically
- Capture transient faults
- View groups of signals as values
Features
- Monitor correlated waveforms of individual signals, even from different devices
- Group bus signals and show the decoded bus value as well as pin values
- With XJAnalyser Module: monitor live values of selected signals
- With XJAnalyser Module: create simple or complex trigger conditions based on combined logic levels or rising/falling signal edges
- In XJDeveloper: correlate signal values with XJEase code line numbers from the test being run, to aid debugging
- Save waveform data to file for subsequent analysis or comparison
Waveform Viewer brings many of the capabilities found in traditional logic analysers to the Boundary Scan domain.
Used in conjunction with XJAnalyser, Waveform Viewer gives much greater insight into circuit behaviour, effectively closing the loop between graphically stimulating and monitoring digital signals over JTAG, by showing pin values over time rather than just at the current moment.
Used with XJDeveloper, Waveform Viewer greatly enhances test debugging capabilities by recording driven and read values on each monitored pin at every step of the test. Being able to trace the exact line number in the code where the behaviour is unexpected means that problems can be understood quickly, then resolved and verified in the minimum time.

Configure your products


