Various circuit faults can cause JTAG chain errors. This application note describes the most common faults and how to use JTAG Chain Debugger to find the source of the problem.
JTAG Chain Debugger’s Check Chain command runs the following sequence:
- Count the number of devices in the chain.
- Read each device’s ID code and search for matching BSDL files in the library.
- Measure the total length of the instruction registers in the chain and check it against the total to be expected based on data in the BSDL files.
- For each device in the chain, measure its sample register length and compare it to the value stated in its BSDL file.
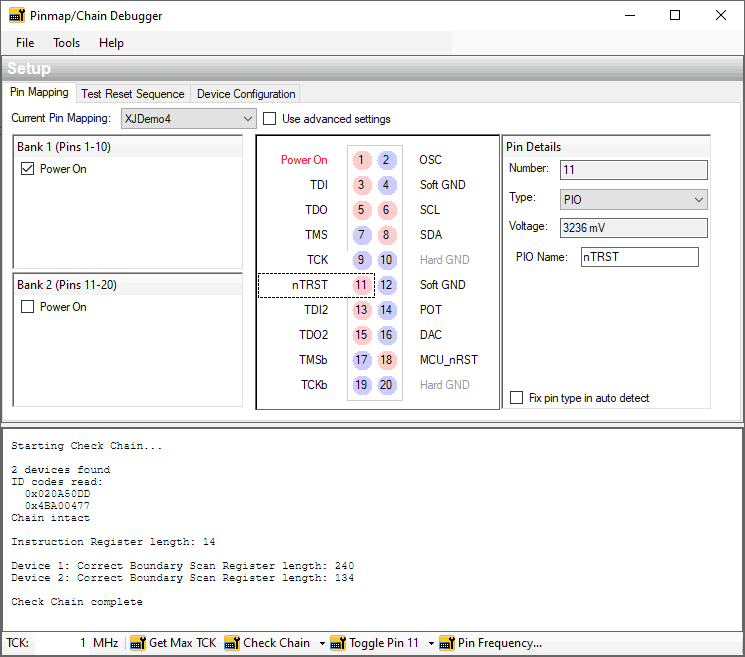
This confirms the JTAG chain is working correctly, and it is recommended that this test is performed as part of creating a project. It can be run by clicking the Check Chain button at the bottom of the JTAG Chain Debugger screen:
Figure 1 – Running Check Chain from JTAG Chain Debugger
Common problems with the JTAG chain are:
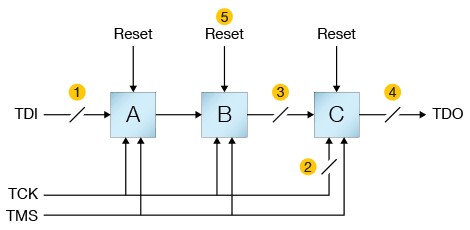
- One of the external signals (TDI, TMS, TCK or TDO) is open circuit or shorted, such as errors 1 and 4 in Figure 2
- One of the common signals (TMS or TCK) is open circuit to just one device, such as error 2 shown below.
- One of the links between devices is broken, such as error 3.
- One of the devices is in reset, such as error 5. This is the most frequently witnessed problem.

Figure 2 – Circuit Faults in a Three-Device JTAG Chain
If fault 1 is present, all devices will still function correctly and their ID codes will therefore all be read satisfactorily during the Check Chain test. However, the test also counts the number of devices in the chain by putting them all into BYPASS mode, clocking a known data pattern into the chain, and waiting for that pattern to emerge from the final TDO. Fault 1 will prevent this happening, and the software will therefore report that it has failed to count the number of devices in the chain, even though it displays their ID codes.
If fault 2 is present on a device (i.e., one IC has a missing TCK and/or TMS signal), no data can be clocked out of its TDO pin. If this fault lies with the final device, no data will be seen from the chain. If it occurs on an earlier device in the chain, data would be read from the final TDO, so the ID codes of devices after the affected one will still be read correctly; the ID codes of the affected device and those earlier in the chain will be missing. Also, because data on TDI cannot be clocked through the complete chain, the Check Chain test will report it is unable to count the number of devices.
If fault 3 is present, no data will be transferred between the devices, although the ID codes of devices after the break will all be read correctly. The number of ID codes read will therefore not match the number of devices on the board. Again, because this stops data passing all the way through the chain, the Check Chain test will report it is unable to count the number of devices.
If fault 4 is present, the effect would be the same as if the last device in the chain has no TMS or TCK signal, is in reset, or needs a Test Reset Sequence but it hasn’t been correctly applied. The Check Chain test will report that no valid data was present.
If fault 5 is present on a device, i.e., it is being held in reset (or a required Test Reset Sequence has not been correctly applied), it will be unable to drive its TDO pin. If the device with the fault is the last one in the chain, this means no data can be read from the chain. If the affected device is earlier in the chain, the test will be able to read ID codes from devices after the one being held in reset. In either case, data cannot be clocked all the way through the system, meaning that the Check Chain test will also report an inability to count the number of devices.
Examples
These board faults will be found by running the Check Chain test. The possible outcomes of the test and how they relate to these different faults are described below, using an example of a chain with two JTAG devices.
Example 1: All ID Codes Read but Number of Devices Not Counted

Because the ID codes of both devices have been read correctly, the following conclusions can be drawn:
- TCK and TMS are functioning correctly on both devices (i.e. not fault 2).
- The link between the devices is intact (i.e. not fault 3).
- The final TDO is correctly connected (i.e. no fault 4).
- Neither device is in reset (i.e. not fault 5).
The number of devices is counted by feeding a known sequence into the TDI pin of the first device. Because XJTAG has been unable to count the number of devices, the conclusion is that the TDI signal is not reaching the first device in the chain.
Example 2: Some ID Codes Missing and Number of Devices Not Counted

Because some of the ID codes have been read, the final device must be functioning correctly:
- TCK and TMS are functioning correctly on the final device (i.e. not fault 2 on the final device).
- The final TDO is correctly connected (i.e. not fault 4).
- The final device in the chain is not in reset (i.e. not fault 5 on the final device).
The fault must therefore lie with the first device or the connection between the two devices and could be caused by one of the following issues:
- Although TCK and TMS are functioning correctly on the second device, one or both of those signals is open circuit on the first device.
- The two devices are not connected together (fault 3).
- The first device in the chain is in reset or requires a Test Reset Sequence that has not been correctly applied (fault 5).
Example 3: No Valid Data Returned

In this example, no valid data is being read from TDO. This could be caused by various issues:
- TMS and/or TCK to the final device are not functioning correctly (fault 2).
- The final TDO is not correctly connected (fault 4).
- The final device in the chain is in reset (fault 5) or it requires a Test Reset Sequence that has not been correctly applied.
Manual Debugging
To help pinpoint the cause of problems, a continuous cycle of a JTAG reset followed by a read of the ID codes can be performed by clicking Scan ID Codes from the Check Chain pulldown menu. Putting the JTAG Chain Debugger into this mode makes data flow continually through the chain and allows an oscilloscope to be used to help locate the source of the problem.


